Sunday, March 20, 2011

GBP/USD Analysis 032011

Good night everyone, great date and weekend I hope :)
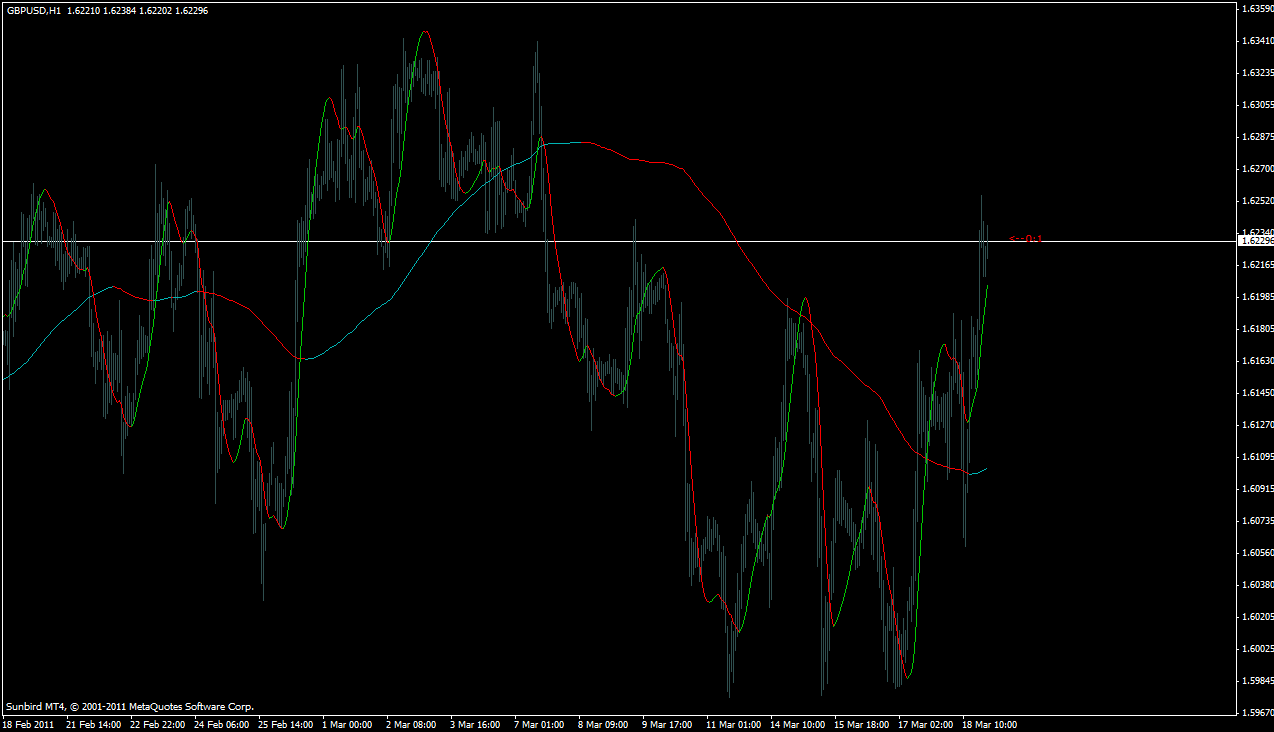
Allright, before we start our trading days tomorrow I'll share you my view on GBP/USD. This time I'll go through a more comprehensive, detailed view on each time basis to give you example how to analyze each wave using different approach and tools.
Why trouble ourselves with so many tools? Well, thing is nobody knows where and how far the price might go, so we need as much data as possible to judge the situation and minimize risk. Here's where our chart analysis concept comes into play. Chart analysis itself is all about gathering as much information as possible, using certain concept or approach to get a good view of market condition.
There are basically two important things we want to find out, the tendency of price direction, and the critical levels that the price might go to (I take these levels as "frame" within which the price is moving).
But in the end it's all just prediction and probability, so there's always room for error, therefore risk is always part of the game, that's the reality. Well, if you can't accept it then don't trade forex at all :D

We'll be using some tools, the core tools of KG analysis concept, they are KGB levels (modified fib), Bollinger Bands (BB) SD 1, BS band, LSMA, and range calculator.

Allright here we go, first is monthly


We'll go through wave analysis first, notice the KGB levels (it's the aqua modified fib. The price is still playing above the B (Buyers) level (1.6094), it's indicating that here buyers are still in control of the market.
Notice that price is moving up leaving the B level, so buyers might try to retest the H (high at 1.6343).
Next take a look at the BS band (1.6161), it's dynamic monthly median level. This level is important because that's where the dynamic balance is, a level where buyers and sellers strenght is equal. Now based on this level, price is already above it meaning buyers are having the upper hands.
So far our conclusion is buyers win.
Next is based on bollinger bands (BB). Take a look at the BB shape, notice that the bands are flat, indicating sideways condition. Notice also that price is moving in range within the bands and currently is trying to break SD 1 band. So based on BB price is still in normal or sideways condition, it's a consolidation or staging phase before the next move.
And next is the LSMA. Notice it's previously pointing down and now it starts pointing up, indicating that based on regression the direction tends to be upward.
And last is the range, notice that current month range is 367 pips, about 56% of the average monthly range which is 654 pips. So there's still vast room to move either up or down.
And now our conclusion here, monthly is in sideways or consolidation phase, but overall condition buyers are still in control and there's tendency the price is heading up.
Assuming the price is moving up our first focus should be the SD 1 band, if it's broken then our next focus should be the high (1.6343).
On the other hand if this consolidation continues then our focus should be the middle and the SD -1 bands, also the B level (1.6094). If SD -1 band and B level are broken, then monthly will enter downtrend phase and next target might be the B (Balance) level at 1.5845.

Next is weekly


Wave analysis using the Magenta KGB the current upwave is retrace from the previous downwave. Notice price is trying to break the B level (1.6252). This is a critical level to watch, if it's broken then buyers will have total control and might try to push the price towards the H (1.6344), otherwise price might go down trying to hit the B (1.6161).
Now based on BS band (1.6115), the price is above it indicating buyers are in control.
Next based on BB. Watch the shape, notice that the middle band is pointing up and the bands are expanding, also the price is moving up outside the SD 1 zone, indicating that weekly is in uptrend or abnormal up phase.
Now LSMA is also pointing up, and already crossed both BS band and BB up, it's also indicating uptrend.
And last the range, current weekly range is 278 pips which is 88% of the weekly average. So it might be there's only few space left for the current uptrend.
Okay our conclusion is weekly is clearly in uptrend phase, so our job is watch the B level (1.6252), if it's broken then next destination might be the H (1.6344) otherwise it might go down and try to hit the BS (1.6161), and don't forget based on range there's not much space left so we might see a pause or pullback soon.

And lastly, daily


Based on wave analysis we still have the magenta KGB as our basis and our conclusion is similar to the weekly analysis above, focus is the B level (1.6252).
Based on BS band (1.6157) it's buyers winning.
Next based on BB, daily is in uptrend phase, notice the shape, the angle, and the price position is outside the SD 1 zone, everything is indicating uptrend.
Now based on LSMA, it's uptrend too.
Last is range, notice current range is 194 pips, 147% of the daily average.
Allright, what do we have here? Daily is clearly in uptrend phase, our nearest focus is the B level (1.6252), watch if this level is broken or not. But based on range, it looks like buyers are already overstretched, so here we might expect to see some pullback soon, it might even lead to reversal, who knows.
Thing is if there's really pullback, then our focus should be the SD 1 band and LSMA, if the price manages to play under LSMA within the SD 1 zone, then daily will be in consolidation phase, and if LSMA flattens or turns down, then direction may change.

Allright now we have clear view on monthly, weekly, and daily basis, what's next?
Next is trading plan or strategy, it depends entirely on individual style.
First determine which basis we're focusing on to make our trade, and specify in what condition or criteria we make our trade, and when we cut our losses.
Are you looking for a trend, or reversal, or whatever it is, you should be able to identify the condition, set the criteria you want, set your target and stop loss, and then make the trade.

Allright, that's all for now, hope it helps, it's moto2 race starting by the way, I'm going to watch it :D

Saturday, March 19, 2011

Time Based Wave

In KG analysis concept, one important concept is the KG wave concept. It is said that "smaller waves move in the bigger waves direction and biger waves are formed by smaller waves".
If you wonder what a wave is, it is the price movement itself.
Now I'm not going to write all the theory here because it can be really confusing, even to me :D, if we can't see the application in the market then what's the use?
So I'll just go right away to the chart and let the picture say it all, I find it much easier to understand that way.
And mind you this concept differs greatly from Elliot Wave concept, so for you who are familiar with Elliot Wave (and hold it like a virtue) you might find this very difficult to accept :D

Okay first the wave itself is basically infinite, ranging from the smallest wave to the biggest one, and there is virtually no pattern in the move, it's random.
One thing very sure is it's just moving up and down, and that's the only pattern we have.
So to overcome this randomness another important thing in KG concept is the KG Time concept, in this we divide the waves based on time.
And this time is based on real life business cycle, so in this concept we have daily, weekly, monthly, yearly, etc etc, even the smaller intraday waves such as 8, 4 or even 2 and 1 hourly are used if needed.
Here we'll use LSMA to identify the wave. Why LSMA? Well, you can really use any tool you're familiar with but this LSMA is the standard tool we currently use to read market direction due to its more representative nature. If you don't have the indicator, just ask uncle google :D

Okay in this picture we can see the monthly wave, it's 120 period LSMA if you're on TF H4.


Notice the LSMA represents monthly movement, or wave. We will assume this as the big wave. Upwave is represented by aqua while downwave is represented by red.

And next we can see the daily wave, it's 6 period LSMA.


Notice that within the monthly wave, whether it's up or down there's this smaller wave, the daily moving in up and down rhythm but in general it's moving following the monthly direction.

Now let's take a look at it closer on H1, here the monthly is 480 period LSMA while daily is 24 period LSMA.


The monthly wave is formed by the smaller wave, in this case daily wave, and the daily wave is moving in the monthly wave direction.
Now within this daily wave, there are also smaller waves moving. Here for example we can see 4 hourly wave.
For better view, we'll switch to m15, monthly is 960 period, daily is 96 period and 4 hourly is 16 period.


See it closer, there's even smaller wave still, for example 1 hourly wave. This time we switch to m5, daily is 288 period, 4 hourly is 48 period, 1 hourly is 12 period.


So far I hope you can see what it means by "smaller waves move in the bigger waves direction and biger waves are formed by smaller waves".

Now you might wonder what's the use of this concept.
This concept helps us to read the overall price direction, from the big picture down to the very detail. I already wrote that the trend is something relative, it depends on where we're seeing it from and to, using this concept we can read the trend easily because here we have time as our basis.
One other thing is this concept really offers us wide degree of flexibility in our trades. Depends on our trading style, we can focus to any waves we choose, we might focus on monthly or longer if we trade on longer term, or weekly wave if we trade on midterm basis, daily for intraday, even smaller waves such as 8 or 4 hourly for scalping.

Well, that's all for tonight, I hope you find this useful :)

Friday, March 18, 2011

Trading Journal 031811

EUR/CHF

Sell EUR/CHF @1.27045


Result: SL hit, closed @1.26956 :D

EUR/USD

Sell EUR/USD @1.40528


Result: Cut loss @1.40912 when everything's indicating uptrend, it was really a good setup, oh well :( :( :(

USD/CAD

Buy USD/CAD @0.98311


Result: SL hit, closed @0.98090
I hate it when my SL got hit while the price is really going my way. I wonder if I set it way too tight, just slightly below the day low.

Thursday, March 17, 2011

GBP/USD Analysis 031811

Morning everyone,
Let's see what happens to GBP/USD this morning, starting with monthly


Following the previous downtrend phase monthly is in normal or sideways phase today. In this kind of situation, the price will move in range within SD 1 zone, as we can see here the price is really moving between the MA and SD -1 band. This phase will end if the price moves outside (either up or down) SD 1 zone.

Now let's see how the weekly is


Weekly is in abnormal up or uptrend phase, following the previous normal phase the price is trying to breakout of SD 1 zone, and MA is slightly pointing up. It's an indication that buyers are trying to take weekly into uptrend phase, we don't know whether or not they will succeed. They still have monthly MA to break before the uptrend can continue.

Now let's see how the daily is


Previously daily was in uptrend phase and now the price is in SD 1 zone, so it's in normal phase. We can say this normal phase is a pause or consolidation, we can see the MA is still pointing up sharply and the price is trying to break SD 1 band.
Notice that the daily MA is already crossed the weekly MA up, indicating there might be longer term reversal, we don't know that yet.
Now our final task is watch the daily phase and the price action.
If daily SD 1 band and monthly MA is broken, then daily and weekly will be in uptrend phase the next target could be monthly SD 1 band. On the other hand if those levels hold, then daily and weekly bands should be our focus since weekly and daily will be in normal phase.

Trading Journal 031711

AUD/JPY

Buy AUD/JPY @77.181


Result: closed @77.582

NZD/JPY

Buy NZD/JPY @56.816


Result: closed @56.826, SL got hit, but still with profit :D

Buy NZD/JPY again @56.900


Result: closed @57.107

Wednesday, March 16, 2011

GBP/USD Analysis 031711

Morning everyone, let's start this day with some chart analysis and coffee :D

I'll start with monthly


Monthly is in abnormal down or downtrend phase, the price is outside SD 1 zone. Notice that the MA is still rather flat, we don't know yet how strong the downtrend is currently, if MA is pointing down later then we can assume the downtrend is strong.

Now we'll see weekly


Weekly is also in downtrend phase, notice that MA is pointing down and price is outside SD 1 zone, not much to say really, simply put, it's down.

And now daily


Daily too is in downtrend phase.
So here in this pair all the three basis clearly indicating down, but notice that there's support around 1.5980. As we can see so far the price is unable to break that support, it might hold or it might not, God only knows :)
So our job is to watch that level, if it's broken then the downtrend might continue, otherwise the price might move into daily/weekly SD 1 zone and daily/weekly might enter normal or sideways phase.

GBP/USD Analysis 031611

Good night everyone, how's your trade today? Alot of profit I hope :)
It's rather late to post my analysis (I should've done it this morning). But I guess it's better late than never :)
This time I'm still using the basic analysis technique with BBMA (that's Bollinger Bands and Moving Average).

Let's see first how the monthly (480 period) move first


The MA is rather flat but notice that the price is already below the SD -1 band. It's indicating that there's some effort to turn monthly into downtrend phase from previously normal or sideways phase. The price retested the SD -1 band today but unsuccessful, well, it could mean we might see a longterm downtrend in the near future, we don't know yet since we have to watch also the shorter term moves as well.

Now let's see how the weekly (120 period) is


The price is ranging in normal zone between the weekly MA and SD -1 band. One important thing is weekly MA is already below monthly MA, indicating that the shorter term average is now lower than the longer one, and based on KG's concept we know that big waves are formed by the smaller waves.
So it could mean this weekly MA will lead monthly MA into a downtrend, who knows.
But thing is, currently the price is still within weekly normal zone, so our current assumption is price will be still ranging within the weekly bands, unless the price dives and breaks the SD -1 band, in that case downtrend is confirmed.

And now we'll see how the daily (24 period) is


Here daily is also in ranging phase and looks like the price is trying to break daily SD -1 band, indicating that sellers are trying to take control. Notice also the daily MA is below the weekly MA, again indicating that shorter term average is below the longer one, could it lead to a downtrend? Nobody knows :D
So here our conclusion so far is monthly is in (a beginning of) downtrend phase while weekly and daily are still in sideways phase.
Next thing to do is watch the daily and weekly. If the price dives and breaks weekly and daily SD -1 bands, then downtrend is confirmed, but if the price flies then watch the daily MA and SD +1 bands, weekly SD -1 band and monthly SD -1 band. If those levels broken then daily will be in uptrend phase while weekly and monthly will be in normal or sideways phase, and the next points to watch will be weekly SD +1 band and monthly MA.
Now how do we confirm direction? Use any tool or method you're familiar with. I personally use LSMA and Heiken Ashi.
The most important thing is we already have the "frame", the critical levels within which the price will likely to move.

Tuesday, March 15, 2011

Trading Journal 031611

Trading multiple accounts can be really confusing, but fun :D
Wish me luck everyone...

EUR/JPY

Buy EUR/JPY @112.975, SL @112.600, TP @113.175


Result: closed @112.985
I really hate it when it keeps slipping while I'm trying to close the position. I tried to close it at about +23 pips but ended up with 1 pip after my SL +1 got hit, damn...

GPB/JPY

Buy GPB/JPY @129.930, SL @129.450. TP @130.400


Result: closed @129.950, SL +2 got hit

AUD/JPY

Buy AUD/JPY @80.180, SL @79.700, TP @80.500


Result: closed @80.401, closed it earlier since I saw it having some trouble with the MA

XAG/USD

My very first time ever trading silver, buy XAG/USD @34.328, SL @33.770. TP @34.700


Result: SL @34.338 hit XDXDXD

XAU/USD

Also my very first time trading gold live, sell XAU/USD @1399.38, SL @1408.71


Result: SL hit @1398.76
Hmmm, I wonder if I locked my profit way too early, I guess I have to really learn the rhytm

AUD/USD

Very tight spot, barely any space at all, sell AUD/USD @0.99145, SL @0.9957


Result: closed @0.98928 :D

Sunday, March 13, 2011

GBP/USD Analysis 031411

Hi all, ready to start the week?
Here's my view on GBP/USD today, again I'll be using only basic analysis concept using Bollinger Bands. It might look complicated but actually no, it's really simple.
It's based on KG's wave and time concept.
Simply put the smaller waves move in the bigger waves direction, and the bigger waves are formed by the smaller waves. And we divide the waves based on time.

Let's start with monthly (480 period)


Notice the middle band (it's SMA by the way)is rather flat, it's indicating that monthly is in sideways phase. But notice also the price is already outside the SD 1 zone, it's below SD -1 band. The price tried to retest the band on Friday but unable to break it.
So here it's already in abnormal condition, an indication that a downtrend might occur. But if the price breaks the SD -1 band then monthly will be in normal or sideways condition and the next target might be the middle band.

Now, let's see the weekly move (120 period)


The price is outside the SD 1 zone, it's below SD -1 band, notice the middle is pointing down, so weekly is in downtrend or abnormal down phase. So here our assumption is down unless the price breaks SD -1 band. If it happens then weekly will be in normal phase and the next target might be the middle band.

Now daily (24 period) move


Daily is really in sideways or normal phase. Notice the middle band is flat, and price currently is right at the middle, this is a gray situation.
The next move will start from here. If price managed to break the daily SD 1 and weekly SD -1 bands, then daily will enter uptrend phase while weekly will enter normal phase. And assuming monthly SD -1 band is also broken the next target might be the weekly middle band.
On the other hand if price moves down then the downtrend at weekly continues and our focus will be the daily SD -1 band, if it's broken then daily will be in downtrend phase following the weekly. It also means that monthly too will be in downtrend phase.

So what do we do next? Now we'll use LSMA to determine direction.


Notice LSMA is pointing up but price is below it, an indication that there's an effort to reverse direction. So what we do here is we'll watch how the price and the LSMA react. Enter only when direction is confirmed and the way is clear.

EUR/USD Analysis 031311

Good night everyone, I hope you're having a nice weekend.
First my condolence to the people in Japan for the tsunami that hit the country, I wish them the best and hope everything will get better soon, God bless you.
It really reminds me of 2004 tsunami that hit Aceh, a friend of mine lost his relatives and friends there, his father dragged by sea water but managed to survive. It was really nightmare, a horror beyond your imagination.
Okay, back to forex, I really have no idea how the tsunami will impact the market, but I'll share my view anyhow.

This time I'll go through the very basic analysis concept, the very basic that one should learn before moving to a more complex concept. I must warn you though that altough this is a very basic concept but it's a very powerful one, it's more than enough to help you read the move and make constant profit.
This analysis concept is based on average, standard deviation and time concept, using Bollinger Bands (BB) as primary tools.
I don't really use this setup today but this setup works and valid nevertheless.

Allright let's start with EUR/USD, all Bollinger Bands (BB) is set to standard deviation (SD) 1.

First we'll see the bigger picture, the monthly (480 period) move


As we can see price is in the SD 1 zone, so we can say that monthly is in normal phase, in this phase price will move within range between SD 1, middle and SD -1 bands. We can see that price is bounced off the middle and moved up and now it's at SD 1 band.
This is critical level to watch, if this level is broken then monthly will enter uptrend phase otherwise price will be still in normal phase and probably will retest the middle band.

Now we'll see weekly (120 period) move


Here it's also in normal phase, the price is coming from below and hit the middle band. So based on weekly we have this middle band as critical point. If it's broken then the next logical target might be the SD 1 band, otherwise it might retest the SD -1 band.
So far based on the two time basis we have two critical points to watch, the monthly SD 1 band and the weekly middle band, next we'll see how the daily (24 period)is.


Here the price is in abnormal up or uptrend phase, we can see the price is outside SD 1 zone, and middle band (the MA) is pointing up. Now the question is, how far will the price go?
As we already have on monthly and weekly phase, we have the monthly SD 1 and weekly middle band to watch, and beyond those we have weekly SD 1. So if the uptrend continues these points will be our focus. Otherwise we will have two additional points to watch, the daily SD 1 and middle bands.
And how do we know if the price is still moving up or about to reverse? The answer is use something that helps us to identify direction. In this case, I'm using LSMA set to daily (24 period).
Why daily? Actually depends on your focus and style you can use any period you like. I use daily since I'm focusing only on intraday trade. If you trade on longer term you might to focus on weekly or monthly and use 120 or 480 period LSMA for direction, it's your choice. You can even use longer period, like six monthly or yearly for instance for longer term trade.
Here's the picture


As we can see LSMA is pointing up and price is above it, it's an uptrend really.
How do we tell the current uptrend is weakening?
Watch the price action. If price starts to move below the LSMA, it's a sign that the uptrend is weakening. Next we should wait and see if the LSMA is flattening or turning down and price is moving down too, then it's a sign of reversal. How far will it go? Again, watch the bands, see how the price reacts at those bands and how the LSMA is.

Saturday, March 5, 2011

A Simple Way To Read A Trend

The trend is your friend,
Okay, everyone knows that, but ask different people about the trend on the same TF, and guarantee we'll get different answer.
Why? Because the trend is something really relative. It depends on where we're seeing the chart from and to.
For example in this picture:


If we see it from A-B, the trend is up. But if we see it from B-C, then it's down, and if we see it from A-C, then again the trend is up.
So which one is right? All of them is right. Because as I already mentioned, it depends on where we see it from and to.
One major problem in identifying a trend is there's no single, universal or standard way to do it. People have different approach based on their own knowledge and concept, so this "trend" can be quite complicated thing.

In the analysis concept I'm using (it's KG's analysis concept), one important basic concept is the TIME concept. To put it simple, we categorize the price movement based on time, such as daily, weekly, monthly, yearly, 8 hourly, etc etc (please don't confuse it with the chart TF).

The very basic technique to read the move is by using moving average (MA). Any MA will do, but in this case I'll use only SMA.

Take a look at this picture:


In the picture I plot a 24 period SMA (that represents 24 hourly, or daily movement), applied to close. Can you see the pattern there? (If you can't then there's something wrong with your eyes :D)
Okay there's one very important thing to know, the price moves in a cycle. It's trending-sideways cycle. Or in KG's concept it's called normal-abnormal cycle, where normal means the price is close to the average while abnormal means the price is far from the average. So here trending is considered as abnormal phase while sideways is considered as normal phase.
Visually, trending or sideways can be seen easily by the MA angle.
But, what's more important is the price action, how the price reacts to the MA.
Trending is when price is moving away from the MA, retrace is when price is moving towards the MA from previous trend, and sideways is when price is just moving around the MA.

Now how do we tell if the trend is about to begin or about to end. Then we'll use Bollinger Bands (BB)


Here I plot period 24 BB, standard deviation (SD) 1.
Why SD 1? Well, based on statistic concept (correct me if I'm wrong since math is not my background) standard deviation is used to measure how far data is spread from the average. Low SD value indicates that the data is close to the average while high SD value indicates that the data is far from the average.
The majority of the data (or in forex case, the price), approximately 68% is spread within SD 1. And we all aware that something that is close to the average or majority is considered normal.
So we use the SD 1 bands to identify the trending or sideways condition.

Here's how to read it.
If the price is outside SD 1 bands and moving away from the MA, then it's trending. It's confirmed by the MA slope or direction.
If it's trending but price starts to move inside SD 1 bands, then the trend is weakening or about to end.
If the price is moving inside SD 1 and the MA is flat or flattening from previous sharp angle, then it's sideways.
If it's sideways but price starts to move outside SD 1 bands, then a trend is about to begin, it's confirmed by the MA slope.

And the distance between bands also indicates something.
If the bands are expanding then the range is expanding meaning the move is strengthened.
If the bands are contracting then the range is tightening meaning the move is weakening.
If the bands are flat then the range is relatively constant meaning it's sideways.

Allright, that's all for now, hope you find it useful :)

Thursday, March 3, 2011

The Four Virtues

The key to succeed in trading is not the capital, it's not how much money we start with. In fact I've seen some people build their account from scratch and became millionaires, and some people start with big money but end up losing nearly (if not) all their money.
The key to succeed in trading is really within ourselves, it's our mental attitude.
Forex trading is all about internal struggle. Yes, our worst and only enemy is ourselves, not the market. We don't fight the market, we just follow it, the market is like a river that flows.
Then I remember these old games, The Ultima series (I really miss the games by the way), the hero is the avatar, champion of eight virtues. These virtues are the foundation upon which the society is built. Straying from these virtues will lead to disaster.
Well I believe in forex trading, based on my experience, there are also these virtues every trader should uphold.
They are: KNOWLEDGE, DISCIPLINE, PATIENCE, and COURAGE.
Lacking one of those will lead to failure.

LinkWithin


Cho